查询 Profile 概述
简介
Query Profile 记录了查询中所有工作节点的执行信息,帮助您快速识别影响查询性能的瓶颈。它是 StarRocks 中诊断和调优查询性能的强大工具。
从 v3.3.0 开始,StarRocks 支持为使用 INSERT INTO FILES() 和 Broker Load 进行的数据加载提供 Query Profile。有关所涉及指标的详细信息,请参见OlapTableSink Operator。
如何启用 Query Profile
启用 Query Profile
您可以通过将变量 enable_profile 设置为 true 来启用 Query Profile
SET enable_profile = true;
SET GLOBAL enable_profile = true;
慢查询的 Query Profile
不建议在生产环境中长期全局启用 Query Profile,因为它可能会增加额外的系统开销。要仅捕获和分析慢查询,请将变量 big_query_profile_threshold 设置为大于 0s 的持续时间。例如,将其设置为 30s 意味着只有超过 30 秒的查询才会触发 Query Profile。
-- 30 seconds
SET global big_query_profile_threshold = '30s';

-- 500 milliseconds
SET global big_query_profile_threshold = '500ms';

-- 60 minutes
SET global big_query_profile_threshold = '60m';
运行时 Query Profile
对于长时间运行的查询,在完成之前很难确定进度或检测问题。运行时 Query Profile 功能 (v3.1+) 在执行期间以固定的时间间隔收集和报告 Query Profile 数据,从而提供对查询进度和瓶颈的实时洞察。
启用 Query Profile 后,运行时 Query Profile 会自动激活,默认报告间隔为 10 秒。可以使用 runtime_profile_report_interval 调整间隔
SET runtime_profile_report_interval = 30;
配置
| 配置项 | 类型 | 有效值 | 默认 | 描述 |
|---|---|---|---|---|
| enable_profile | 会话变量 | true/false | false | 启用 Query Profile |
| pipeline_profile_level | 会话变量 | 1/2 | 1 | 1: 合并指标; 2: 保留原始结构 (禁用可视化工具) |
| runtime_profile_report_interval | 会话变量 | 正整数 | 10 | 运行时 Query Profile 报告间隔(秒) |
| big_query_profile_threshold | 会话变量 | 字符串 | 0s | 为超出此持续时间的查询启用 Query Profile(例如,'30s'、'500ms'、'60m') |
| enable_statistics_collect_profile | FE 动态 | true/false | false | 为统计信息收集相关查询启用 Query Profile |
如何获取 Query Profile
通过 Web UI
- 在您的浏览器中访问
http://<fe_ip>:<fe_http_port>。 - 点击顶部导航栏中的 queries。
- 在 Finished Queries 列表中,选择您要分析的查询,然后点击 Profile 列中的链接。
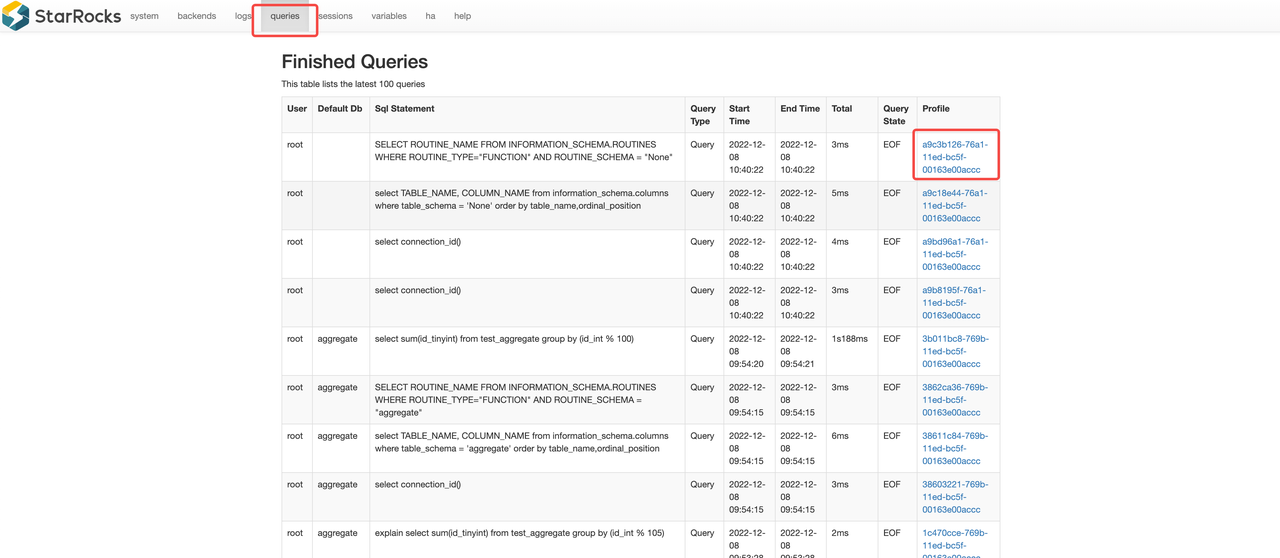
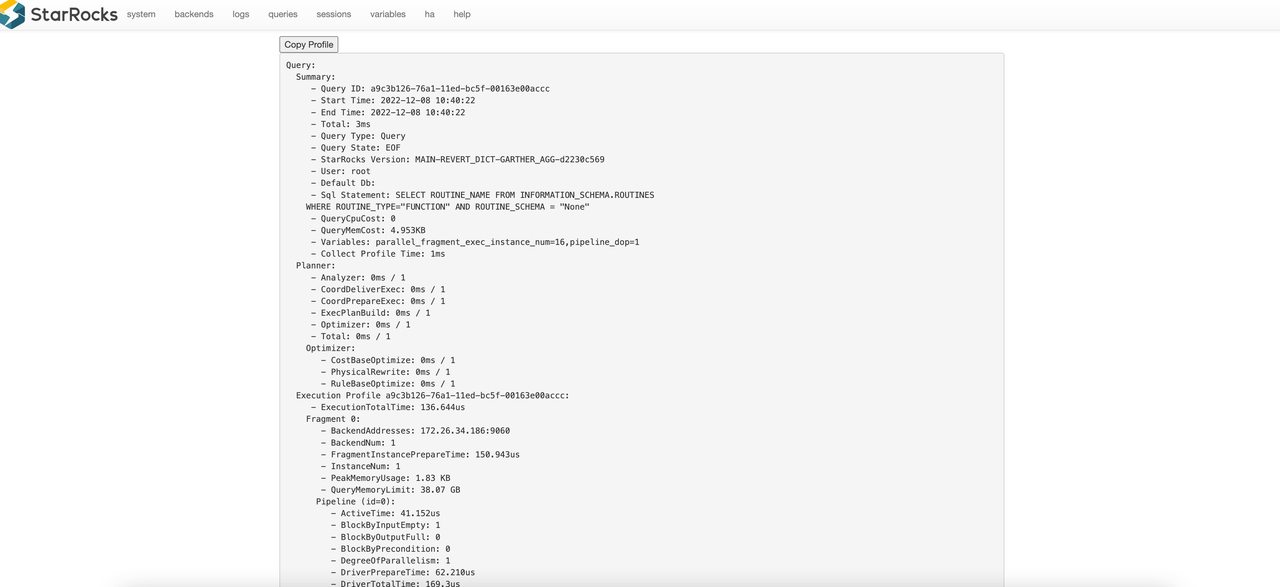
您将被重定向到所选 Query Profile 的详细信息页面。
通过 SQL 函数 (get_query_profile)
示例工作流程
last_query_id(): 返回您会话中最近执行的查询的 ID。用于快速检索上次查询的 profile。show profilelist;: 列出最近的查询及其 ID 和状态。使用此命令查找 profile 分析所需的query_id。get_query_profile('<query_id>'): 返回指定查询的详细执行 profile。使用此命令分析查询的执行方式以及时间和资源的消耗位置。
-- Enable the profiling feature.
set enable_profile = true;
-- Run a simple query.
select 1;
-- Get the query_id of the query.
select last_query_id();
+--------------------------------------+
| last_query_id()                      |
+--------------------------------------+
| bd3335ce-8dde-11ee-92e4-3269eb8da7d1 |
+--------------------------------------+
-- Get the list of profiles
show profilelist;
-- Obtain the query profile.
select get_query_profile('502f3c04-8f5c-11ee-a41f-b22a2c00f66b')\G
在托管版本中
在 StarRocks Managed (Enterprise) 环境中,您可以方便地从 Web 控制台的查询历史记录中直接访问查询 profile。托管 UI 提供了每个查询执行 profile 的直观、可视化的表示,使您可以轻松分析性能并识别瓶颈,而无需手动 SQL 命令。
解释 Query Profile
Explain Analyze
大多数用户可能会发现直接分析原始文本具有挑战性。StarRocks 提供了一种 基于文本的 Query Profile 可视化分析 方法,以便更直观地理解。
托管版本
在 StarRocks Enterprise Edition (EE) 中,托管版本提供了用于查询 profile 的内置可视化工具。此工具提供了一个交互式图形界面,与原始文本输出相比,可以更轻松地解释复杂的查询执行详细信息。
可视化工具的主要功能包括
- Operator 级别的分解: 以树或图的形式查看执行计划,并清楚地显示每个 operator 的指标(时间、行数、内存)。
- 瓶颈突出显示: 通过颜色编码的指示器快速识别慢速或资源密集型 operator。
- 向下钻取功能: 单击任何 operator 以查看详细的统计信息,包括输入/输出行、CPU 时间、内存使用情况等。
如何使用
- 打开 StarRocks Managed Web 控制台。
- 导航到 Query 或 Query History 部分。
- 选择一个查询,然后单击 Profile 或 Visualize 按钮。
- 浏览可视化的 profile 以分析性能并识别优化机会。
此可视化工具是 Managed/Enterprise Edition 独有的,旨在加速复杂工作负载的故障排除和性能调优。